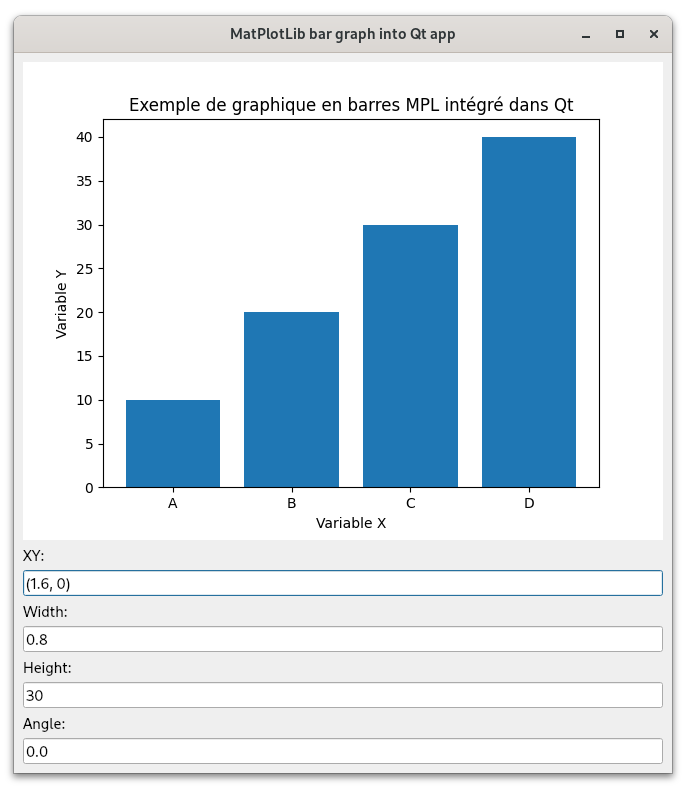
Le programme suivant crée une application Qt qui intégre un graphique en barres à l'aide de Matplotlib. Il est à noter que les barres sont cliquables : en cas de clic, les information de la barre cliquées seront présentées en bas de la fenêtre (voir capture d'écran en bas de la page).
1 2 3 4 5 6 7 8 9 10 11 12 13 14 15 16 17 18 19 20 21 22 23 24 25 26 27 28 29 30 31 32 33 34 35 36 37 38 39 40 41 42 43 44 45 46 47 48 49 50 51 52 53 54 55 56 57 58 59 60 61 62 63 64 65 66 67 68 69 70 71 72 73 74 75 76 77 78 79 80 81 82 83 84 85 86 87 88 89 90 91 92 93 94 95 96 97 98 99 100 |
import sys from PySide6.QtWidgets import QMainWindow, QApplication from matplotlib.figure import Figure from matplotlib.backends.backend_qt5agg import FigureCanvas import sys from PySide6.QtWidgets import QMainWindow, QApplication, QVBoxLayout, QLabel, QLineEdit, QWidget from PySide6.QtCore import Qt from matplotlib.figure import Figure from matplotlib.backends.backend_qt5agg import FigureCanvas class MyWindow(QMainWindow): def __init__(self): super().__init__() self.setWindowTitle("MatPlotLib bar graph into Qt app") # Layout principal main_layout = QVBoxLayout() # Un Widget MatPlotLib est placé au centre self.__canvas = FigureCanvas(Figure()) self.__canvas.mpl_connect("button_press_event", self.canvasClicked) self.__plt = self.__canvas.figure.subplots() main_layout.addWidget(self.__canvas) # Labels et LineEdits pour afficher les informations self.xy_label = QLabel("XY:") self.xy_edit = QLineEdit() self.xy_edit.setReadOnly(True) self.width_label = QLabel("Width:") self.width_edit = QLineEdit() self.width_edit.setReadOnly(True) self.height_label = QLabel("Height:") self.height_edit = QLineEdit() self.height_edit.setReadOnly(True) self.angle_label = QLabel("Angle:") self.angle_edit = QLineEdit() self.angle_edit.setReadOnly(True) main_layout.addWidget(self.xy_label) main_layout.addWidget(self.xy_edit) main_layout.addWidget(self.width_label) main_layout.addWidget(self.width_edit) main_layout.addWidget(self.height_label) main_layout.addWidget(self.height_edit) main_layout.addWidget(self.angle_label) main_layout.addWidget(self.angle_edit) central_widget = QWidget() central_widget.setLayout(main_layout) self.setCentralWidget(central_widget) # Données d'exemple x = list("ABCD") # Possible, car une string est itérable ! y = [10, 20, 30, 40] # Tracé du graphe en barres self.__plt.bar(x, y) # Décoration du graphe self.__plt.set_xlabel("Variable X") self.__plt.set_ylabel("Variable Y") self.__plt.set_title("Exemple de graphique en barres MPL intégré dans Qt") def canvasClicked(self, event): for rect in self.__plt.containers: for bar in rect: if bar.contains(event)[0]: self.display_bar_info(bar) return def display_bar_info(self, bar): xy = bar.get_xy() width = bar.get_width() height = bar.get_height() angle = bar.get_angle() self.xy_edit.setText(f"({xy[0]}, {xy[1]})") self.width_edit.setText(str(width)) self.height_edit.setText(str(height)) self.angle_edit.setText(str(angle)) if __name__ == "__main__": app = QApplication(sys.argv) myWindow = MyWindow() myWindow.show() sys.exit(app.exec()) |
Et voici le résultat produit par cet exemple : pensez à cliquer sur le graphe pour obtenir les informations sur la barre sélectionnée.


Améliorations / Corrections
Vous avez des améliorations (ou des corrections) à proposer pour ce document : je vous remerçie par avance de m'en faire part, cela m'aide à améliorer le site.
Emplacement :
Description des améliorations :