

Bug

Links


Accès rapide :
Présentation du widget Canvas
Le nouveau composant de tracé de courbes
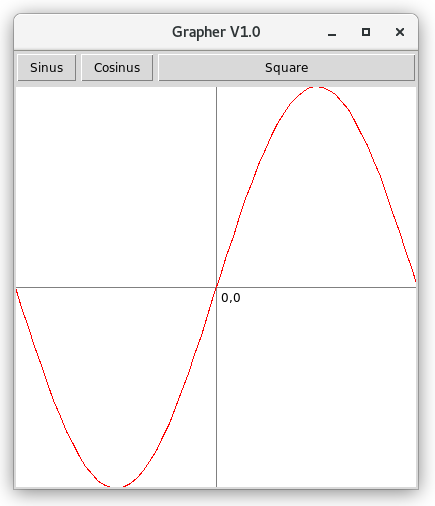
La fenêtre intégrant le widget de tracé de courbes
Un Canvas est un widget permettant de dessiner sur sa zone d'affichage.
L'exemple proposé ci-dessous va vous permettre de tracer des courbes trigonométriques (ou autre) dans un Canvas.
Il est découpé en deux parties.
Le fichier GrapherCanvas.py défini un nouveau type de widget par héritage. Ce nouveau widget acceptera une fonction à dessiner, ainsi que les bornes de la zone de tracé :
ces informations seront précisées grâce aux propriétés présentent dans la classe.
Le fichier Grapher.py contient une fenêtre Tkinter qui intègre notre nouveau widget de tracé de courbes ainsi de quelques boutons permettant de choisir la courbe à tracer.
1 2 3 4 5 6 7 8 9 10 11 12 13 14 15 16 17 18 19 20 21 22 23 24 25 26 27 28 29 30 31 32 33 34 35 36 37 38 39 40 41 42 43 44 45 46 47 48 49 50 51 52 53 54 55 56 57 58 59 60 61 62 63 64 65 66 67 68 69 70 71 72 73 74 75 76 77 78 79 80 81 82 83 84 85 86 87 88 89 90 91 92 93 94 95 96 97 98 99 100 |
import math from tkinter import Canvas class GrapherException(Exception): def __init__(self, message): Exception.__init__(self, message) class GrapherCanvas(Canvas): def __init__(self, parent, width, height, background): Canvas.__init__(self, parent, width=width, height=height, background=background) self.xMin = -math.pi self.xMax = math.pi self.yMin = -1 self.yMax = 1 self.f = math.sin self.redraw(width, height) @property def xMin(self): return self.__xMin @xMin.setter def xMin(self, value): if not isinstance(value, int) and not isinstance(value, float): raise GrapherException("minimale value for abscissa must be a numeric value") self.__xMin = value @property def xMax(self): return self.__xMax @xMax.setter def xMax(self, value): if not isinstance(value, int) and not isinstance(value, float): raise GrapherException("maximale value for abscissa must be a numeric value") self.__xMax = value @property def yMin(self): return self.__yMin @yMin.setter def yMin(self, value): if not isinstance(value, int) and not isinstance(value, float): raise GrapherException("minimale value for ordinate must be a numeric value") self.__yMin = value @property def yMax(self): return self.__yMax @yMax.setter def yMax(self, value): if not isinstance(value, int) and not isinstance(value, float): raise GrapherException("maximale value for ordinate must be a numeric value") self.__yMax = value @property def f(self): return self.__f @f.setter def f(self, func): if not callable(func): raise GrapherException("func must be a callable element") self.__f = func def redraw(self, width=None, height=None): w = width or self.winfo_width() h = height or self.winfo_height() tx = lambda x: w * (x-self.xMin)/(-self.xMin + self.xMax) ty = lambda y: h * (1 - (y-self.yMin)/(-self.yMin + self.yMax)) # Delete all existing graphical elements self.delete( "all" ) # Draw origin self.create_line(tx(self.xMin), ty(0), tx(self.xMax), ty(0), fill="gray") self.create_line(tx(0), ty(self.yMin), tx(0), ty(self.yMax), fill="gray") self.create_text(tx(0)+15,ty(0)+10, text="0,0", fill="black") # Draw the curve i = self.xMin oldX = tx(i) oldY = ty(self.f(i)) while i<self.xMax+0.1: x = tx(i) y = ty(self.f(i)) self.create_line(oldX, oldY, x, y, fill="red") oldX = x oldY = y i += |
1 2 3 4 5 6 7 8 9 10 11 12 13 14 15 16 17 18 19 20 21 22 23 24 25 26 27 28 29 30 31 32 33 34 35 36 37 38 39 40 41 42 43 44 45 46 47 48 49 50 51 52 53 54 55 56 57 58 59 60 61 62 |
#!/usr/bin/python3 import math from tkinter import * from GrapherCanvas import GrapherCanvas class MyWindow(Tk): def __init__(self): Tk.__init__(self) verticalPane = PanedWindow( self, orient=VERTICAL ) horizontalPane = PanedWindow( verticalPane, orient=HORIZONTAL ) verticalPane.add( horizontalPane ) btnSinus=Button( horizontalPane, text="Sinus", command=self.sinusClicked) btnCosinus=Button( horizontalPane, text="Cosinus", command=self.cosinusClicked) btnSquare=Button( horizontalPane, text="Square", command=self.squareClicked) horizontalPane.add( btnSinus ) horizontalPane.add( btnCosinus ) horizontalPane.add( btnSquare ) self.__canvas = GrapherCanvas(verticalPane, 400, 400, "white") # Quelques gestionnaires d'événements sur le Canvas self.__canvas.bind("<Enter>", lambda e: self.__canvas.configure(background="cyan")) self.__canvas.bind("<Leave>", lambda e: self.__canvas.configure(background="white")) verticalPane.add( self.__canvas ) verticalPane.pack() self.title( "Grapher V1.0" ) def sinusClicked(self): self.__canvas.xMin = -math.pi self.__canvas.xMax = math.pi self.__canvas.yMin = -1 self.__canvas.yMax = 1 self.__canvas.f = math.sin self.__canvas.redraw() def cosinusClicked(self): self.__canvas.xMin = -math.pi self.__canvas.xMax = math.pi self.__canvas.yMin = -1 self.__canvas.yMax = 1 self.__canvas.f = math.cos self.__canvas.redraw() def squareClicked(self): self.__canvas.xMin = -5 self.__canvas.xMax = 5 self.__canvas.yMin = -1 self.__canvas.yMax = 25 self.__canvas.f = lambda x: x**2 self.__canvas.redraw() window = MyWindow() window.mainloop() |
Voici le résultat produit par cette application.


Améliorations / Corrections
Vous avez des améliorations (ou des corrections) à proposer pour ce document : je vous remerçie par avance de m'en faire part, cela m'aide à améliorer le site.
Emplacement :
Description des améliorations :