Swing - Coder un composant d'affichage de courbes
Accès rapide :
La vidéo
Le code présenté dans la vidéo
La vidéo
Cette vidéo vous apprend à coder votre propre composant Swing d'affichage de courbes mathématiques.
Le concept de « graphics » vous y est présenté.
Apprendre à coder un composant graphique d'affichage de courbes mathématiques
Le code présenté dans la vidéo
Swing permet de produire ses propres composants graphiques. Le plus simple est d'hériter de la classe javax.swing.JComponent.
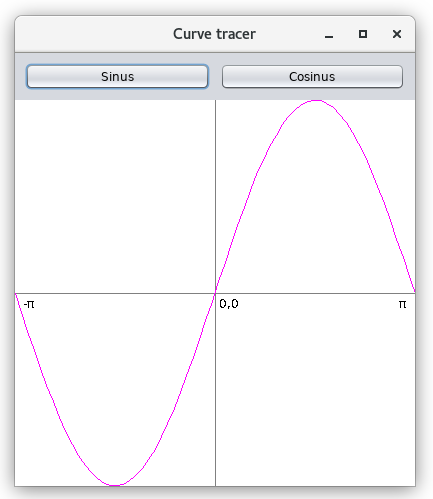
La méthode importante pour nous est paintComponent : c'est elle qui dessine le composant graphique. Par défaut, paintComponent
ne fait pas grand chose. C'est pour cette raison que nous allons la redéfinir afin qu'elle dessine la courbe associée à la fonction en cours (dans
l'exemple, sinus ou cosinus). Voici une capture d'écran montrant le résultat du tracé de notre composant graphique (voir code, ci-dessous).
Un effort a été porté sur la possibilité de changer l'algorithme de calcul pour la fonction à tracer.
Pour ce faire, une interface nommée CurveFunction, directement portée par notre classe de composant (un peu comme sous l'API Android),
a été définie. Un setter lui est associé permettant ainsi de changer la courbe à tracer directement à partir de la fenêtre principale.
 1
 2
 3
 4
 5
 6
 7
 8
 9
 10
 11
 12
 13
 14
 15
 16
 17
 18
 19
 20
 21
 22
 23
 24
 25
 26
 27
 28
 29
 30
 31
 32
 33
 34
 35
 36
 37
 38
 39
 40
 41
 42
 43
 44
 45
 46
 47
 48
 49
 50
 51
 52
 53
 54
 55
 56
 57
 58
 59
 60
 61
 62
 63
 64
 65
 66
 67
 68
 69
 70
 71
 72
 73
 74
 75
 76
 77
 78
 79
 80
|
package fr.koor.swing.curvetracer;

import java.awt.Color;
import java.awt.Graphics;
import java.awt.Graphics2D;
import java.awt.RenderingHints;

import javax.swing.JComponent;

public class CurveCanvas extends JComponent {

    private static final long serialVersionUID = 7800853645256601960L;

    private CurveFunction function = (x) -> Math.sin( x );


    @Override
    protected void paintComponent(Graphics graphics) {
        super.paintComponent(graphics);

        // --- Activate antialiasing flag ---
        Graphics2D graphics = (Graphics2D) graphicsSimple;
        graphics.setRenderingHint( RenderingHints.KEY_ANTIALIASING,
                                   RenderingHints.VALUE_ANTIALIAS_ON );

        // --- White background ---
        graphics.setColor( Color.WHITE );
        graphics.fillRect( 0, 0, getWidth(), getHeight() );

        // --- Draw axis ---
        graphics.setColor( Color.GRAY );
        graphics.drawLine( 0, getHeight()/2, getWidth(), getHeight()/2 );
        graphics.drawLine( getWidth()/2, 0, getWidth()/2, getHeight() );

        // --- Draw values ---
        graphics.setColor( Color.BLACK );
        graphics.drawString( "0,0", (int)(getWidth()*0.51), (int)(getHeight()*0.54));
        graphics.drawString( "-\u03c0", (int)(getWidth()*0.02), (int)(getHeight()*0.54));
        graphics.drawString( "\u03c0", (int)(getWidth()*0.96), (int)(getHeight()*0.54));


        // --- Draw curve ---
        double step = 0.1;
        graphics.setColor( new Color( 255, 0, 255 ) );

        int oldX = xToPixel( -Math.PI );
        int oldY = yToPixel( function.compute( -Math.PI ) );

        for( double lx=-Math.PI+step; lx<= Math.PI+step; lx+=step ) {
            int x = xToPixel( lx );
            int y = yToPixel( function.compute( lx ) );

            graphics.drawLine( x, y, oldX, oldY );

            oldX = x;
            oldY = y;
        }
    }

    public void setFunction(CurveFunction function) {
        this.function = function;
        this.repaint();
    }

    private int xToPixel( double x ) {
        return (int)( getWidth() * (x + Math.PI)/(2*Math.PI) );
    }

    private int yToPixel( double y ) {
        return (int)( getHeight() * (1 - (y + 1)/2.0 ) );
    }


    public static interface CurveFunction {

        public double compute( double x );

    }

}
|
Notre classe de composant graphique
la méthode setFunction permet de changer la courbe à tracer. Afin de forcer une réactualisation immédiate, un appel à la méthode
repaint y a été forcé.
 1
 2
 3
 4
 5
 6
 7
 8
 9
 10
 11
 12
 13
 14
 15
 16
 17
 18
 19
 20
 21
 22
 23
 24
 25
 26
 27
 28
 29
 30
 31
 32
 33
 34
 35
 36
 37
 38
 39
 40
 41
 42
 43
 44
 45
 46
 47
 48
 49
 50
 51
 52
 53
 54
 55
 56
 57
|
package fr.koor.swing.curvetracer;

import java.awt.BorderLayout;
import java.awt.GridLayout;
import java.awt.event.ActionEvent;

import javax.swing.BorderFactory;
import javax.swing.JButton;
import javax.swing.JFrame;
import javax.swing.JPanel;
import javax.swing.UIManager;
import javax.swing.plaf.nimbus.NimbusLookAndFeel;

public class CurveTracer extends JFrame {

    private static final long serialVersionUID = -3914578220391097071L;

    private JButton btnSinus = new JButton( "Sinus" );
    private JButton btnCosinus = new JButton( "Cosinus" );
    private CurveCanvas curveCanvas = new CurveCanvas();

    public CurveTracer() {
        super( "Curve tracer" );
        this.setDefaultCloseOperation( DISPOSE_ON_CLOSE );

        JPanel contentPane = (JPanel) this.getContentPane();

        JPanel pnlTop = new JPanel( new GridLayout( 1, 2, 10, 0 ) );
        pnlTop.setBorder( BorderFactory.createEmptyBorder( 10, 10, 10, 10 ) );
        btnSinus.addActionListener( this::btnSinusListener );
        pnlTop.add( btnSinus );
        btnCosinus.addActionListener( this::btnCosinusListener );
        pnlTop.add( btnCosinus );
        contentPane.add( pnlTop, BorderLayout.NORTH );

        contentPane.add( curveCanvas, BorderLayout.CENTER );


        this.setSize( 400, 470 );
        this.setLocationRelativeTo( null );
    }

    private void btnSinusListener( ActionEvent event ) {
        curveCanvas.setFunction( (x) -> Math.sin( x ) );
    }

    private void btnCosinusListener( ActionEvent event ) {
        curveCanvas.setFunction( (x) -> Math.cos( x ) );
    }

    public static void main(String[] args) throws Exception {
        UIManager.setLookAndFeel( new NimbusLookAndFeel() );
        CurveTracer window = new CurveTracer();
        window.setVisible( true );
    }

}
|
Une fenêtre pour embarquer notre composant
dans les deux gestionnaires d'événements associés aux boutons de changement de courbe, nous avons utilisé des lambda (Java SE 8 minimum) pour simplifier
l'écriture de nos classes anonymes basées sur l'interface ActionListener. Je vous renvoie vers notre tuto Java SE pour de plus amples
informations à ce sujet.


 Utilisation d'un JDesktopPane
 KLink - Un composant de type lien hypertexte
Améliorations / Corrections
Vous avez des améliorations (ou des corrections) à proposer pour ce document : je vous remerçie par avance de m'en faire part, cela m'aide à améliorer le site.
Emplacement :
Description des améliorations :